
Project Management Template (Lite Version)
Learn how to use your Project Management Template (Lite Version) in Excel or Google Sheets. Follow the quick start steps below, or explore detailed FAQs and troubleshooting tips.
Quick Start
Follow these quick steps to start using your template right away.
Template Overview
Get to know how each tab works. Every sheet in your template has a clear purpose, from setup to the final outputs that keep your project organized.
Setup Tab
Purpose
The Setup Tab is where you define how your project will be organized — specifically, your Priority Levels and Status Options. These settings are referenced throughout the template and automatically appear in dropdown lists on the Gantt Tab.
Think of it as your project’s control panel — you can adjust how tasks are categorized and tracked before you start planning.
Why It Works
The Setup Tab ensures every project starts with a consistent structure. By defining your priorities and statuses upfront, you:
Keep your task list clean and standardized.
Make dropdown selections faster and more accurate.
Maintain a shared understanding about what each priority and status means.
Everything stays aligned — no confusion, no messy data, no guesswork.
Try This in Your Template
Open the Setup Tab before entering any tasks.
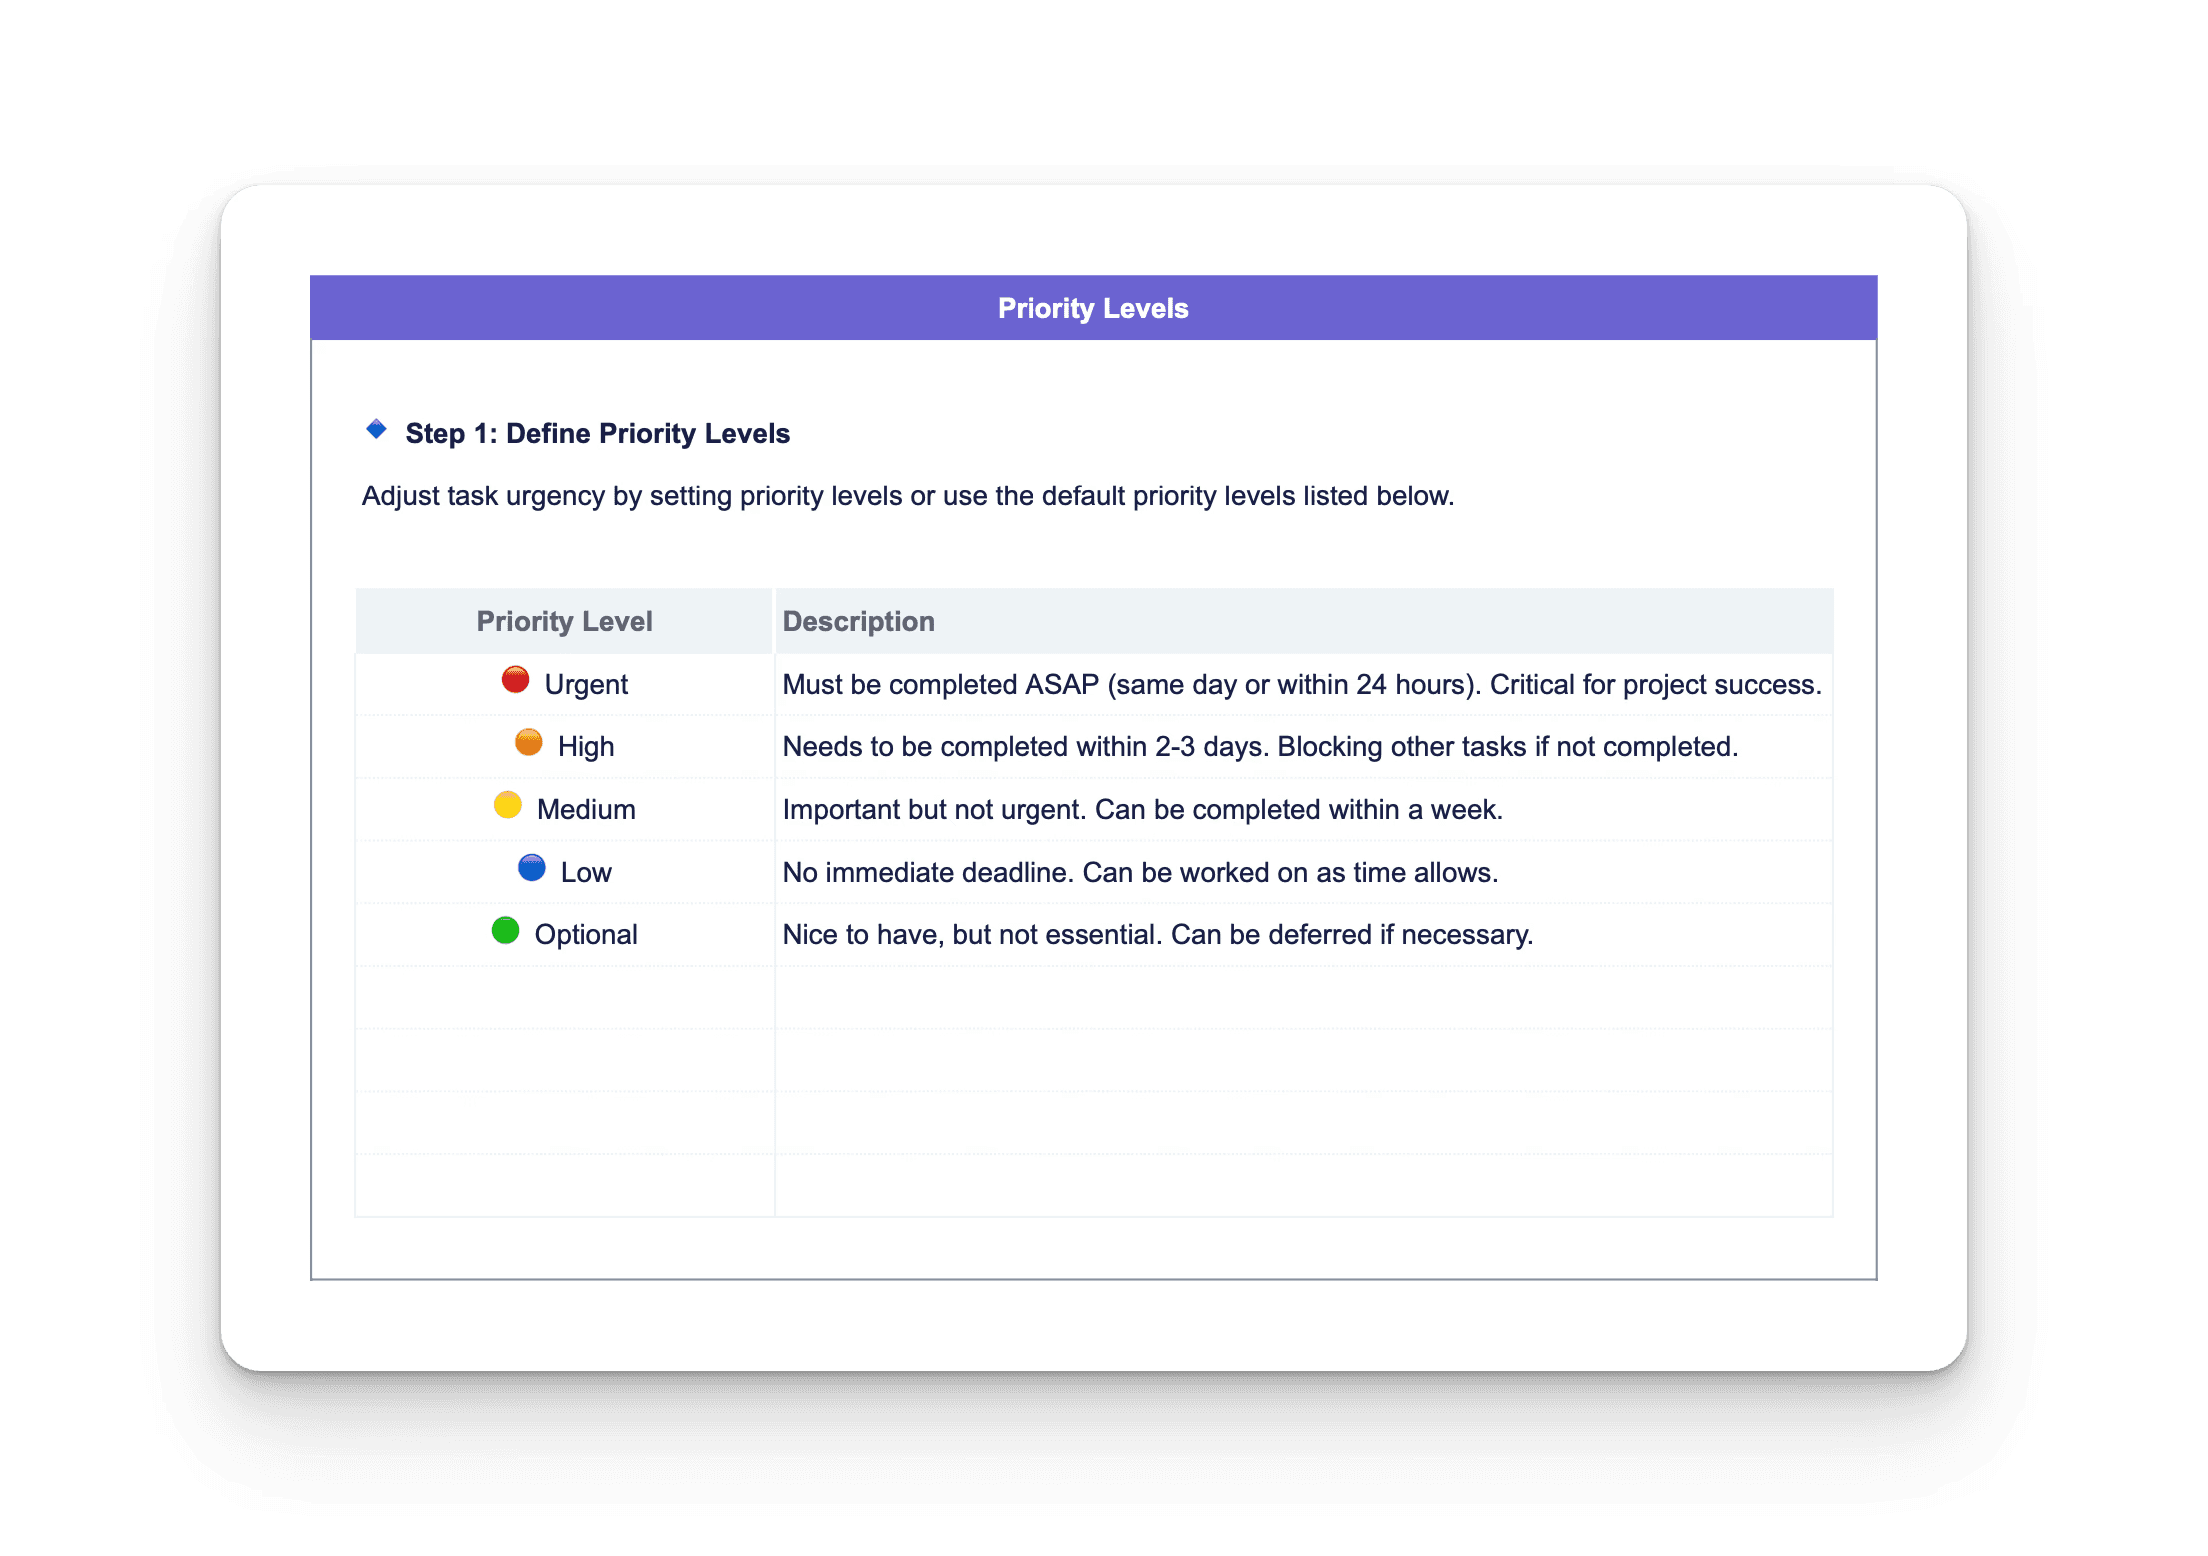
Review the Priority Levels section:
You’ll see five default levels — 🔴 Urgent, 🟠 High, 🟡 Medium, 🔵 Low, and 🟢 Optional.
Adjust the labels or descriptions if your workflow uses different naming conventions.
Review the Status Options section:
Default options include ⏳ Not Started, 🚀 In Progress, 🔄 Needs Review, ✅ Completed, ⛔ Blocked, and 🗑 Cancelled.
You can rename, add, or remove statuses to match your process.
Once you’ve finalized your setup, return to the Gantt Tab to start building your task list.
The dropdowns for Priority and Status will automatically update with your changes.
Tips for Success
Avoid leaving blank cells in the Setup Tab — empty fields will show up as blank options in your dropdowns.
You can customize these values at any time, even mid-project — changes update instantly across the workbook.
Keep descriptions short but clear, especially if others will use your file.
If you make major edits, double-check the dropdowns on the Gantt Tab to confirm they’re pulling the correct values.
Gantt Tab
Purpose
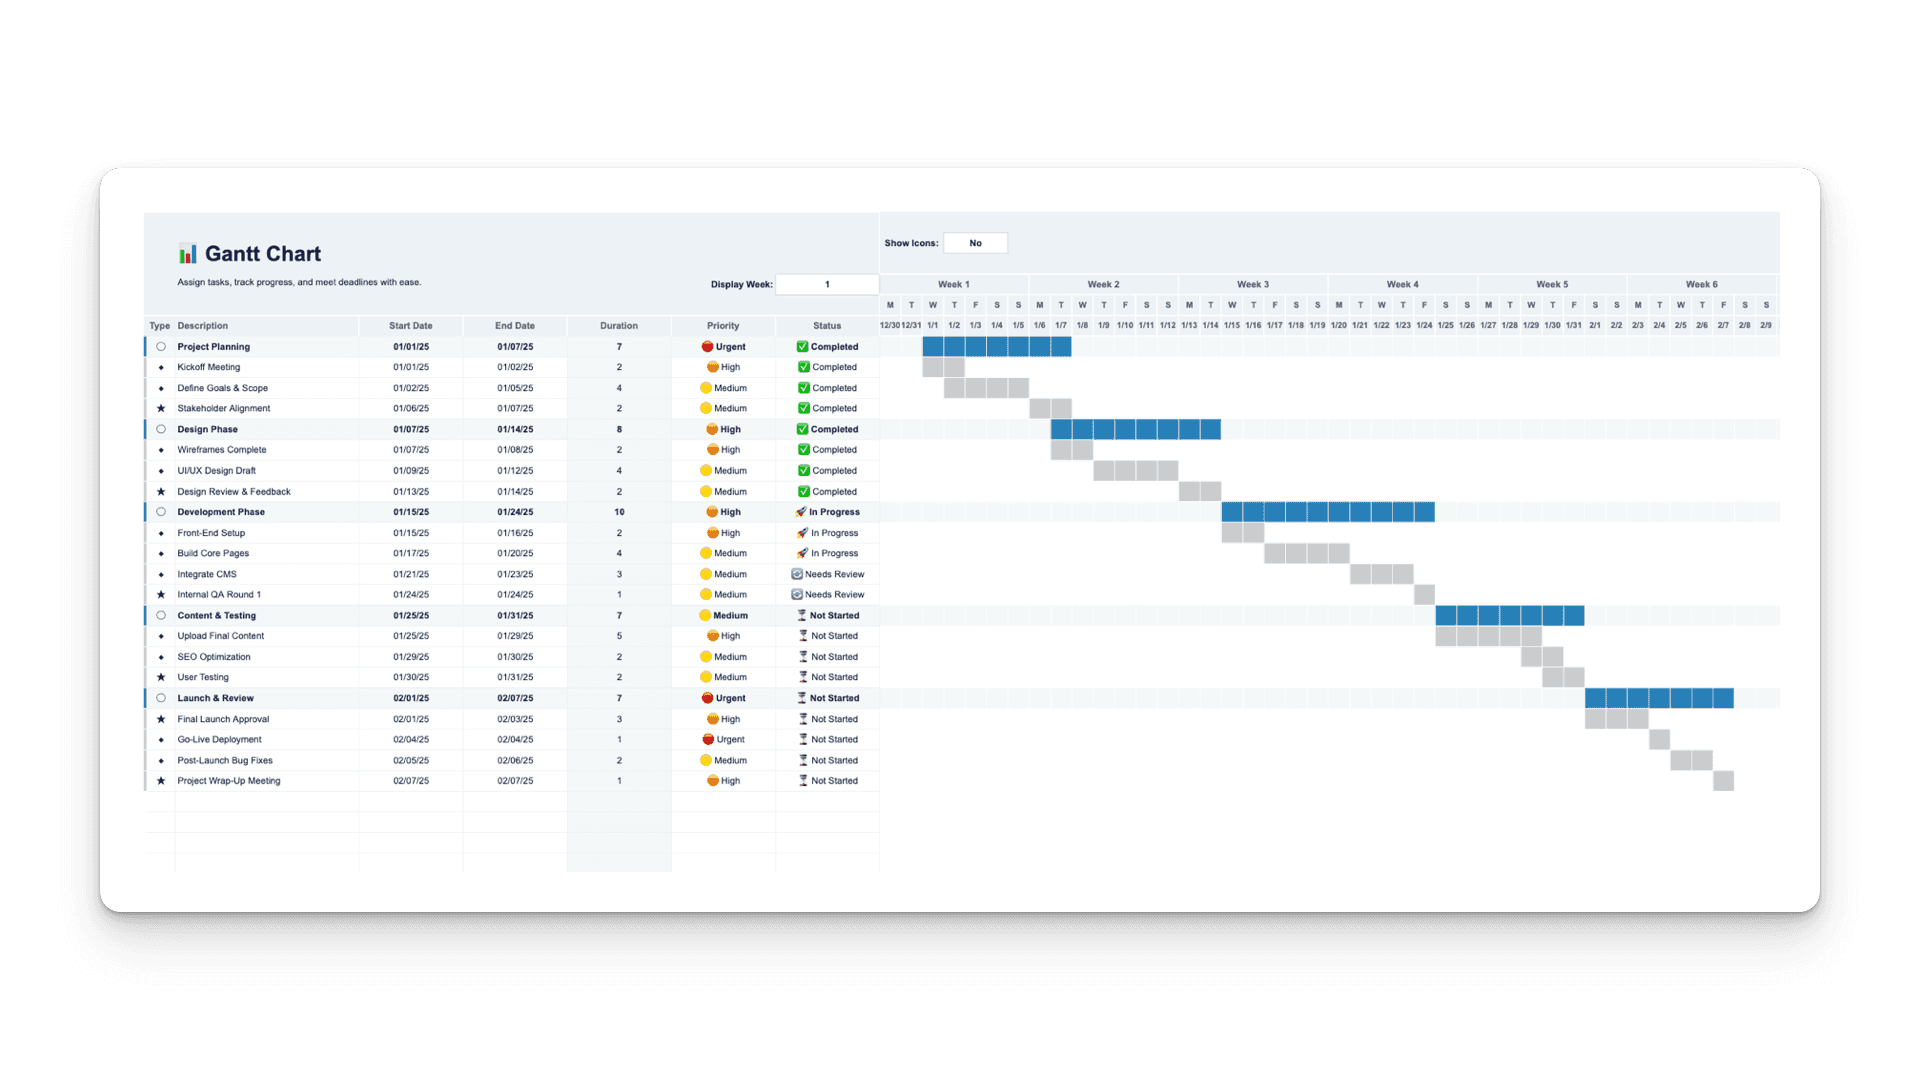
The Gantt Tab is your main project planner — where you map out every phase, task, and milestone along a visual timeline. It’s the foundation of your project tracker, helping you plan, schedule, and monitor progress all in one place.
Everything begins here. Once you enter your project details, your timeline will automatically update to reflect your schedule and progress.
Why It Works
This tab keeps your planning simple and visual.
Instead of juggling multiple tools, you enter your tasks once — and the Gantt chart does the rest:
Your project timeline builds automatically based on the Project Start Date.
You can control which week your Gantt chart displays, making it easy to focus on specific timeframes.
Task durations and progress are displayed in clear, color-coded bars — with categories shown in blue and tasks and milestones in grey.
It’s a lightweight, efficient version of the full project manager — designed for fast setup and easy use.
Try This in Your Template
Set your Project Start Date at the top of the sheet.
This is the anchor point for your timeline. The Gantt chart uses it to determine the first date displayed.
In the Display Week cell, type a number to choose which week your Gantt chart begins with:
Enter 1 to start from Week 1, 2 for Week 2, 3 for Week 3, and so on.
This lets you easily navigate through your project timeline.
Start building your task list:
Use ◯ for Category (e.g., “Design Phase”)
Use ◆ for Task (e.g., “Wireframing”)
Use ★ for Milestone (e.g., “Launch”)
Assign a Priority from the dropdown — 🔴 Urgent, 🟠 High, 🟡 Medium, 🔵 Low, 🟢 Optional.
Set each task’s Status — ⏳ Not Started, 🚀 In Progress, 🔄 Needs Review, ✅ Completed, ⛔ Blocked, or 🗑 Cancelled.
Add a Start Date and End Date for each task — the Duration will calculate automatically.
As you update dates or statuses, the Gantt chart will refresh instantly to show progress.
Adding New Rows
When inserting rows between existing tasks, always make sure to copy the formulas from a working row.
If you insert a blank row and start typing, the new task won’t calculate correctly — durations, progress bars, and formatting won’t update properly.
When Inserting Rows Between Existing Tasks:

(The example above shows Google Sheets, but the same steps apply in Excel.)
Find where you want the new task to go.
Insert a new row in that position.
Copy an entire existing row (one that already works) and paste it into the new blank row.
Replace the text with your new task details — Category, Task Name, Start Date, End Date, etc.
✅ This keeps all formulas and formatting active.
When Adding Rows at the Bottom:
Go to the end of your task list.
Insert a new row below the last task.
Copy an existing row and paste it into the new one.
Fill in your new task details.
✅ The new task will automatically appear on your Gantt chart.
⚠️ Important: Always copy from a row that already contains working formulas.
If you skip this step, the new row won’t calculate or display correctly.
Tips for Success
The Project Start Date controls what appears in your Gantt chart — updating it automatically shifts your schedule.
Use the Display Week selector to jump ahead or review earlier parts of your project without scrolling.
Do not delete rows — hide unused ones instead to preserve formulas.
To reuse this tracker for a new project, clear the task contents (not the formulas).
All colors are preset: categories appear in blue, while tasks and milestones are grey — keeping your chart clean and easy to read.